 Structural wind loads for a building, within its intended cityscape locale, can be key to an economic design by the structural engineer. Physical modeling in the boundary-layer wind tunnel is the best way to obtain these data. The wind-induced forces at each floor level are made up of three components (mean portion, a buffeting component due to incident turbulence, and a dynamic resonant component due to the moving building mass), and these are presented as a set of quasi-static values the structural engineer can input into an analysis package.
The linear mode aeroelastic balance technique takes into account aeroelastic effects that include displacement effects and aerodynamic damping in the measurements, neither of which can be obtained using a rigid base balance (also called an aerodynamic balance). This is particularly important for tall slender towers that are going to respond to wind excitation across the peak of the crosswind force spectrum. Mean, standard deviation, and peak moments are measured about two axes at ground level and the vertical axis for a 360-degree range of wind directions. The standard deviation measurements of the resonant response components are recorded separately. From these measurements, using modal and mass information from the dynamic structural analysis and the chosen ultimate wind speeds, design base moment information are presented as elliptic design envelopes, as well as shear force and moment distributions over the tower for wind azimuths controlling the design.
Using serviceability directional wind speeds based on mean hourly wind speed data, estimates of accelerations are determined at the highest habitable level for a 5-year return period and compared with recommended comfort criteria. For tall buildings this may control the design and even lead to a damping sytem such as a Tuned Liquid Column Damper (TLCD) or a Tuned Mass Damper (TMD).
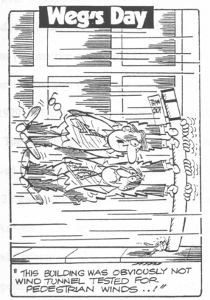 Measurements of local mean and gust wind speeds on and around the small-scale wind-tunnel model can be made in the public and private pedestrian areas and then compared with well-established comfort criteria. MEL Consultants has a database of local wind velocity records as a function of city and wind direction. If the part of the development is found to be windy then MEL Consultants' in-house model making facilities can quickly manufacture architecturally acceptable features and modify the model to explore mitigation where needed. This allows for rapid development and testing of wind amelioration strategies and minimises time in the wind tunnel resulting in lower costs to the client. Finding acceptable architectural or operational solutions at small scale in the wind tunnel is far more cost effective than resolving the wind problems when the project is complete, as suggested in the WEG cartoon (used with permission from William E Green, 1991).
MEL Consultants use hot-wire anemometry to measure the pedestrian wind speeds in the wind tunnel. This technique provides a quantitative measurement of the mean and peak wind speeds that can also be integrated with wind climate probabilities to determine the number of hours per year the wind speed criteria are exceeded for the test locations. This allows developers to make informed decisions as to the level of wind amelioration needed. The hot-wire or hot-film method of evaluating pedestrian wind conditions is well established in wind engineering and aeronautics; having its origins in the NACA work of Schubauer and Klebanoff in the 1940s. It is superior to other techniques such physical erosion or computational fluid dynamics (CFD). A full discussion of the latter may be found in Cochran and Derickson (2011).
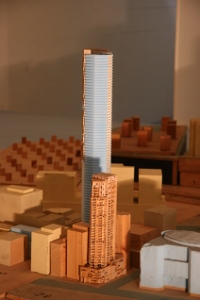
 MEL Consultants has in-house stereolithography and conventional machine shop facilities to construct even the most complex architectural designs. These physical models then have pressure taps installed on the external surfaces prior to placing in the boundary-layer wind tunnel. The wind tunnel is equipped with the latest multichannel, simultaneous-pressure, data-collection system that allows time-series pressure data to be stored from up to 1000 transducers connected to the building model. The computer controlled turntable can be programed to cover 360 degrees of wind azimuth for any arbitrary wind direction increment. Typically 5 degree increments (or 72 wind azimuths) are used to ensure that even the narrow band pressure events are captured, as these can have significant influence on the facade design. Many other laboratories only use an azimith increment of 10 degrees (36 directions). The MEL Consultants' data-reduction system outputs the pressure data in a form that can be viewed in Microsoft Excel (useful for directional analysis to aid in the design of mechanical air handling systems), and also produces coloured contour plots. These coloured plots allow designers and engineers to quickly identify areas of extreme peak pressures that may require additional strengthening or, conversely, low peak pressure areas that may provide potential savings in facade design.
As these pressure time series data are collected simultaneously over the building surfaces the sophisticated data-reduction skills available may result in more targeted design information. For example, the difference in peak pressures across an element such as a porte cochere, canopy, cooling tower, or parapet can yield the correlated net pressure across these potentially wind-sensitive features. In a similar manner many surface taps along the line of a roof beam or portal frame can yield a time series of the centre moment, column shear, or some other action of interest to the structural engineer. By using the structural engineers influence coefficient analysis a large variety of actions can be explored. The inclusion of the structural engineers' dynamic analysis can be used to understand the impact of a resonance, and create quasi-static design loads that include the influence of any resonant amplification of the action on a roof or other element.